
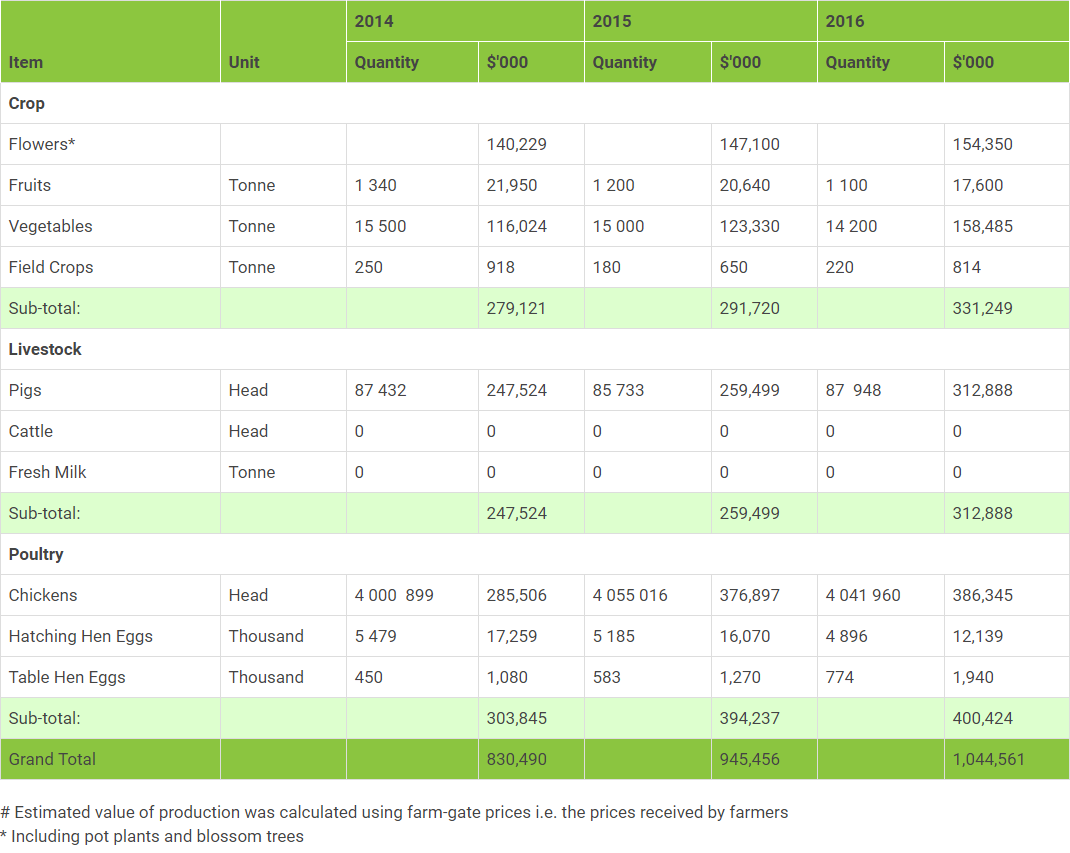
| Item | Unit | 2014 | 2015 | 2016 | ||||||
|---|---|---|---|---|---|---|---|---|---|---|
| Quantity | $'000 | Quantity | $'000 | Quantity | $'000 | |||||
| Crop | ||||||||||
| Flowers* | 2014 | 140,229 | 2015 | 147,100 | 2016 | 154,350 | ||||
| Fruits | Tonne | 2014 | 1 340 | 21,950 | 2015 | 1 200 | 20,640 | 2016 | 1 100 | 17,600 |
| Vegetables | Tonne | 2014 | 15 500 | 116,024 | 2015 | 15 000 | 123,330 | 2016 | 14 200 | 158,485 |
| Field Crops | Tonne | 2014 | 250 | 918 | 2015 | 180 | 650 | 2016 | 220 | 814 |
| Sub-total: | 2014 | 279,121 | 2015 | 291,720 | 2016 | 331,249 | ||||
| Livestock | ||||||||||
| Pigs | Head | 2014 | 87 432 | 247,524 | 2015 | 85 733 | 259,499 | 2016 | 87 948 | 312,888 |
| Cattle | Head | 2014 | 0 | 0 | 2015 | 0 | 0 | 2016 | 0 | 0 |
| Fresh Milk | Tonne | 2014 | 0 | 0 | 2015 | 0 | 0 | 2016 | 0 | 0 |
| Sub-total: | 2014 | 247,524 | 2015 | 259,499 | 2016 | 312,888 | ||||
| Poultry | ||||||||||
| Chickens | Head | 2014 | 4 000 899 | 285,506 | 2015 | 4 055 016 | 376,897 | 2016 | 4 041 960 | 386,345 |
| Hatching Hen Eggs | Thousand | 2014 | 5 479 | 17,259 | 2015 | 5 185 | 16,070 | 2016 | 4 896 | 12,139 |
| Table Hen Eggs | Thousand | 2014 | 450 | 1,080 | 2015 | 583 | 1,270 | 2016 | 774 | 1,940 |
| Sub-total: | 2014 | 303,845 | 2015 | 394,237 | 2016 | 400,424 | ||||
| Grand Total | 2014 | 830,490 | 2015 | 945,456 | 2016 | 1,044,561 | ||||
* Including pot plants and blossom trees
 Top
Top