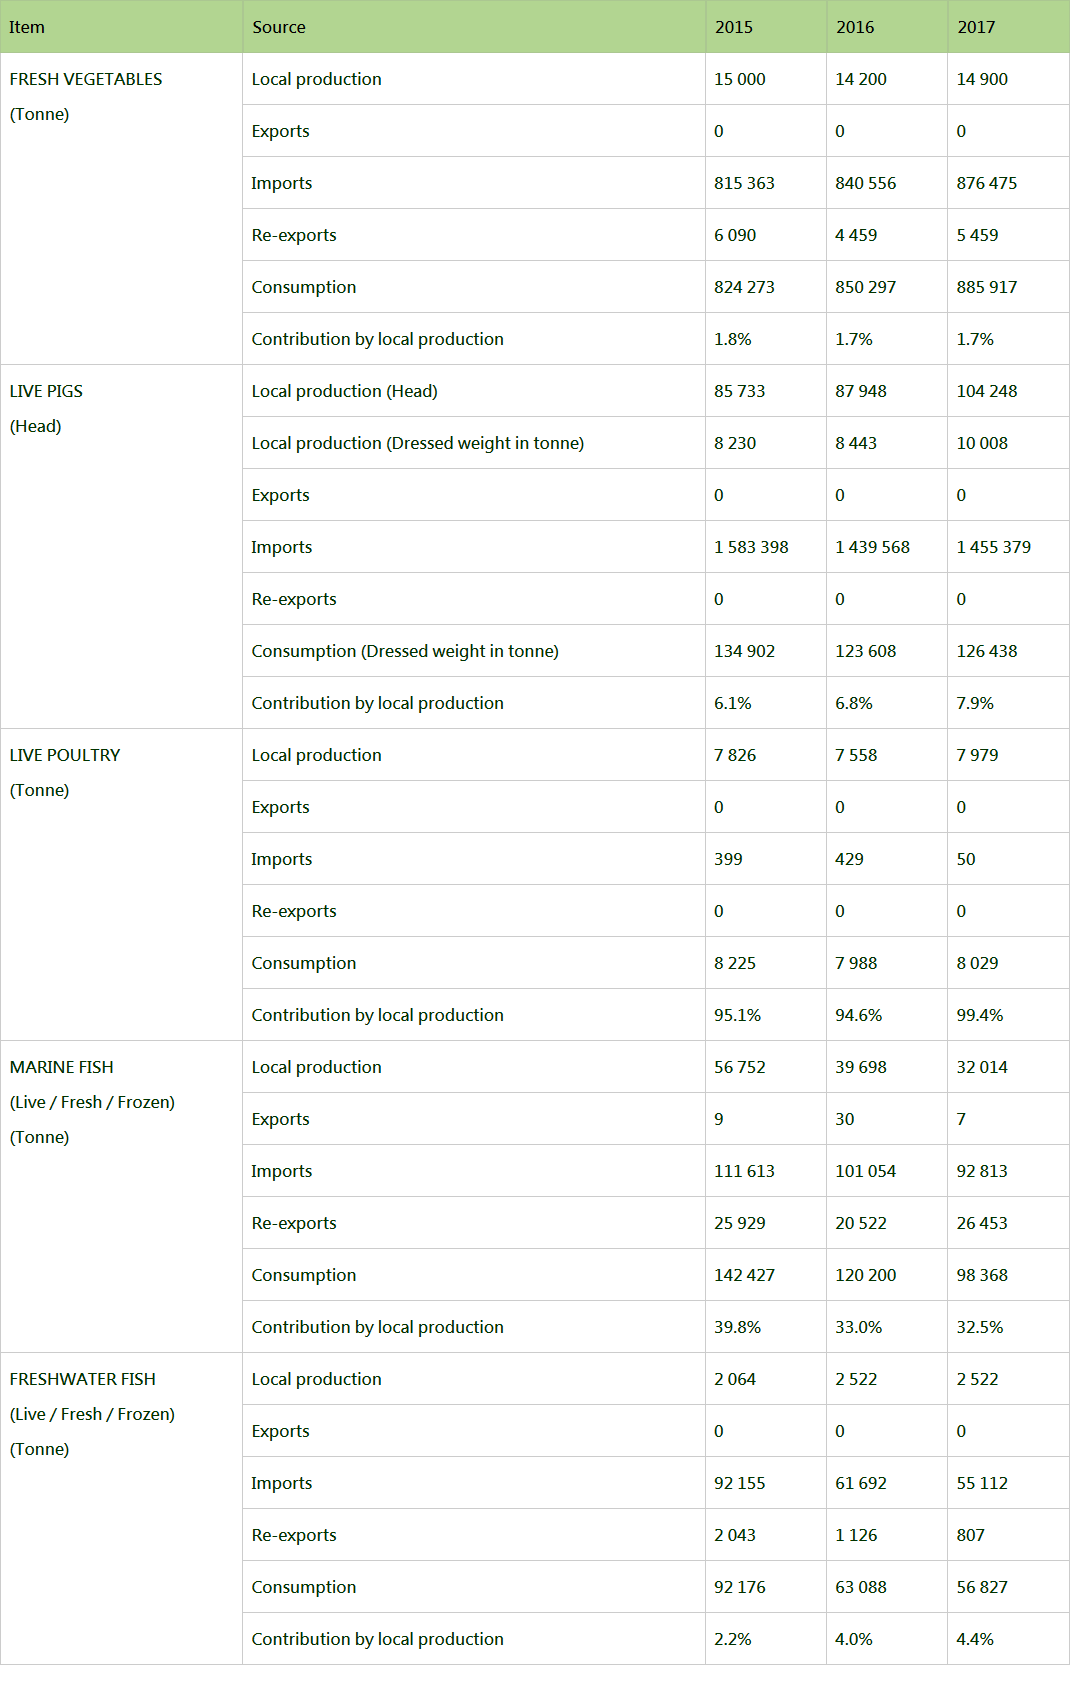
| Item | Source | 2015 | 2016 | 2017 |
|---|---|---|---|---|
| FRESH VEGETABLES (Tonne) |
Local production | 15 000 | 14 200 | 14 900 |
| Exports | 0 | 0 | 0 | |
| Imports | 815 363 | 840 556 | 876 475 | |
| Re-exports | 6 090 | 4 459 | 5 459 | |
| Consumption | 824 273 | 850 297 | 885 917 | |
| Contribution by local production | 1.8% | 1.7% | 1.7% | |
| LIVE PIGS (Head) |
Local production (Head) | 85 733 | 87 948 | 104 248 |
| Local production (Dressed weight in tonne) | 8 230 | 8 443 | 10 008 | |
| Exports | 0 | 0 | 0 | |
| Imports | 1 583 398 | 1 439 568 | 1 455 379 | |
| Re-exports | 0 | 0 | 0 | |
| Consumption (Dressed weight in tonne) | 134 902 | 123 608 | 126 438 | |
| Contribution by local production | 6.1% | 6.8% | 7.9% | |
| LIVE POULTRY (Tonne) |
Local production | 7 826 | 7 558 | 7 979 |
| Exports | 0 | 0 | 0 | |
| Imports | 399 | 429 | 50 | |
| Re-exports | 0 | 0 | 0 | |
| Consumption | 8 225 | 7 988 | 8 029 | |
| Contribution by local production | 95.1% | 94.6% | 99.4% | |
| MARINE FISH (Live / Fresh / Frozen) (Tonne) |
Local production | 56 752 | 39 698 | 32 014 |
| Exports | 9 | 30 | 7 | |
| Imports | 111 613 | 101 054 | 92 813 | |
| Re-exports | 25 929 | 20 522 | 26 453 | |
| Consumption | 142 427 | 120 200 | 98 368 | |
| Contribution by local production | 39.8% | 33.0% | 32.5% | |
| FRESHWATER FISH (Live / Fresh / Frozen) (Tonne) |
Local production | 2 064 | 2 522 | 2 522 |
| Exports | 0 | 0 | 0 | |
| Imports | 92 155 | 61 692 | 55 112 | |
| Re-exports | 2 043 | 1 126 | 807 | |
| Consumption | 92 176 | 63 088 | 56 827 | |
| Contribution by local production | 2.2% | 4.0% | 4.4% |